Doodle Data Chart PowerPoint Template
In today’s fast-moving professional landscape, a presentation isn’t just a sequence of slides—it’s a touchpoint. A moment where clarity meets credibility, where data becomes dialogue, and where your audience decides whether to lean in or scroll away. That’s why the Doodle Data Chart PowerPoint Template matters—not as another decorative asset, but as a deliberate tool for human-centered communication.
More Than Visuals: Why Doodle-Style Data Charts Are Resonating Now
People aren’t rejecting data—they’re rejecting *disconnected* data. We’ve moved past the era where bar charts and pie graphs alone earned trust. Today’s audiences—whether investors reviewing a pitch deck, educators explaining quarterly outcomes, or freelancers presenting campaign analytics—expect information that feels intentional, approachable, and aligned with brand voice. The doodle aesthetic bridges that gap: hand-drawn lines, subtle imperfections, and organic shapes signal authenticity without sacrificing structure. It’s not about childishness; it’s about warmth, accessibility, and cognitive ease.
This shift reflects broader changes in how professionals consume and produce content. Remote collaboration tools, asynchronous updates, and shorter attention windows mean every slide must earn its place. A doodle-style chart doesn’t hide complexity—it frames it gently. A timeline drawn like a winding path, a growth metric sketched as rising stairs, or KPIs arranged inside illustrated speech bubbles—all serve as visual anchors that support memory and meaning.
Evolving Beyond “Pretty Slides” to Purposeful Storytelling
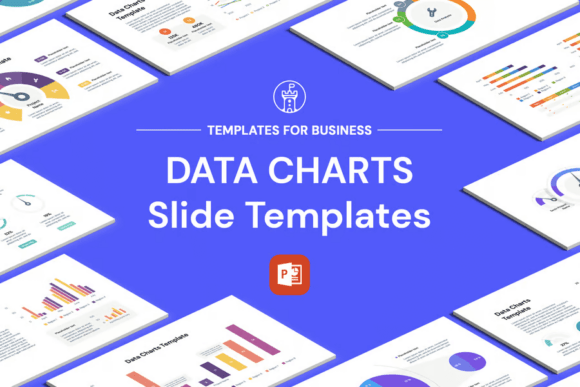
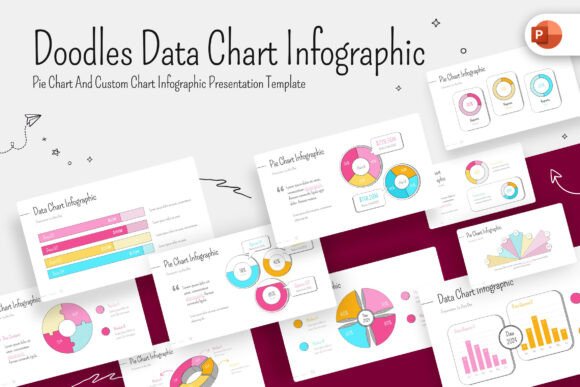
Five years ago, template marketplaces prioritized polish over personality. Today, buyers prioritize adaptability and alignment—does this template reflect *our* tone? Can it scale across departments? Does it integrate smoothly into existing workflows? The Doodle Data Chart Infographic PowerPoint Template answers those questions by design: 30 unique slides, each built around real-world business moments—not abstract concepts. You’ll find dedicated layouts for project kickoffs, competitive positioning maps, milestone retrospectives, and goal recalibration sessions.
What sets it apart isn’t just the doodle motif—it’s the underlying architecture. Each slide is built with Microsoft Office theme colors in mind, meaning you can switch between light and dark backgrounds *without* reformatting text or icons. The 90 XML files allow granular control over individual elements (colors, fonts, spacing), so marketing teams can enforce brand guidelines while finance leads tweak data labels on the fly. And because it’s handmade—not auto-generated—the proportions, spacing, and hierarchy feel considered, not algorithmic.
Real Workflows, Real Needs
Consider a startup founder preparing for seed funding. They need to show traction—but also vision. A standard stacked bar chart might display month-over-month revenue, but a doodle-style version with annotated growth spikes, handwritten callouts, and custom icons for key drivers makes the story stick. Or imagine an HR manager rolling out a new wellness initiative: instead of bullet points listing benefits, a circular doodle infographic illustrates how mental health support connects to retention, productivity, and team morale—with space to insert internal metrics.
Freelancers and educators benefit too. A freelance UX designer can use the template to visualize user journey pain points with illustrated flowcharts. A university lecturer might adapt a process diagram to explain research methodology—keeping students engaged through visual rhythm rather than dense paragraphs. These aren’t hypothetical uses; they’re patterns we’ve seen repeated across the 1,000+ global companies RRGraph Design has supported—from SaaS startups in Berlin to NGOs in Nairobi.
Customization That Doesn’t Compromise Consistency
“Fully customizable” is often code for “endless tweaking.” But true customization means *effortless consistency*. With this template, changing your primary brand color applies instantly across all 30 slides. Swapping a light background for dark doesn’t invert text illegibly—it respects contrast ratios and adjusts icon strokes accordingly. The included Help Guide File walks users through these actions step-by-step, no design expertise required.
The XML structure also supports long-term maintenance. If your company updates its logo or typography next year, you won’t need to rebuild decks from scratch—you’ll update core theme files once, and all presentations inherit the change. That’s not just time saved; it’s institutional knowledge preserved.
Design Integrity Meets Practical Constraints
We know most professionals don’t have hours to spare on formatting. That’s why every doodle element in this pack was created with export stability in mind—no missing fonts, no broken links, no rasterized vectors that pixelate when zoomed. All illustrations are vector-based and fully editable within PowerPoint. Image stocks aren’t included, which keeps file size lean and licensing clear—insert your own photos, screenshots, or branded assets without compatibility concerns.
The widescreen 16:9 format ensures compatibility across modern devices, from conference room projectors to personal laptops during hybrid meetings. And having both light and dark versions means your presentation adapts to venue lighting, time of day, or even audience preference—no last-minute panic over washed-out text.
Why This Fits Into How Teams Actually Work Today
Modern workflows are rarely linear. A sales deck might start in Google Slides, move to PowerPoint for client-facing polish, then get excerpted into a Notion dashboard or LinkedIn carousel. The Doodle Data Chart PowerPoint Template anticipates that fluidity. Its clean layering, logical grouping, and non-destructive editing mean you can extract one chart, paste it into another tool, and retain editability—or convert it to PDF without losing fidelity.
It also respects cognitive load. Unlike templates overloaded with animations or competing visual styles, this pack uses restraint: consistent stroke weights, limited color palettes per slide, and breathing room between elements. That’s not minimalism for its own sake—it’s respect for how people process information under pressure.
A Tool That Grows With Your Goals
Business development isn’t a single event—it’s a cycle. From ideation to validation, scaling to refinement, each phase demands different kinds of clarity. The infographic pack mirrors that rhythm: early-stage slides emphasize exploration and hypotheses; mid-cycle layouts focus on comparison and iteration; final-stage visuals highlight impact and forward momentum. There’s no forced narrative arc—just thoughtful scaffolding for whatever story you’re telling.
And because it’s built by RRGraph Design—a team focused on presentation efficacy, not just aesthetics—you’re not buying pixels. You’re gaining access to a workflow-aware resource shaped by real feedback: what made presenters pause mid-deck to explain a concept? What caused stakeholders to ask follow-up questions? What helped remote attendees stay oriented during screen shares? Those insights live in every curve, margin, and color choice.
Getting Started Without Overwhelm
You don’t need to overhaul your entire library to benefit. Start small: replace one static chart in your next quarterly review with a doodle-style version. Use the timeline layout to map upcoming product milestones. Try the dark version for after-hours virtual sessions where ambient light is low. The value compounds quietly—each use builds familiarity, confidence, and consistency.
Templates don’t transform communication on their own. But the right one—grounded in real needs, built for real constraints, and designed with real people in mind—can remove friction, sharpen focus, and help your message land exactly where it should.