Mastering Data Visualization with Data Chart Powerpoint Templates
Data visualization is no longer a luxury—it’s a necessity. Whether you’re presenting quarterly financial results to stakeholders, explaining complex research findings to students, or pitching a new product concept to investors, how you represent data determines whether your message lands—or gets lost in abstraction. Enter Data Chart Powerpoint Templates: a purpose-built toolkit designed not just for aesthetics, but for clarity, adaptability, and professional credibility.
Why Structure Matters More Than Style
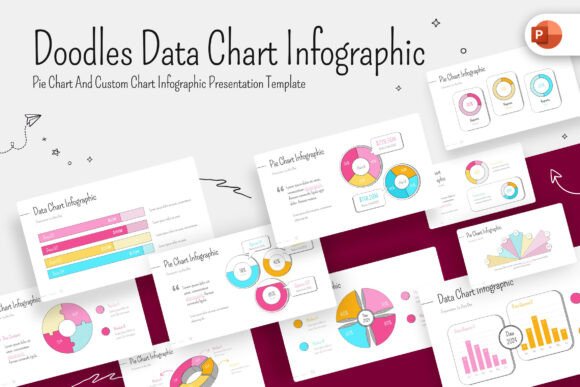
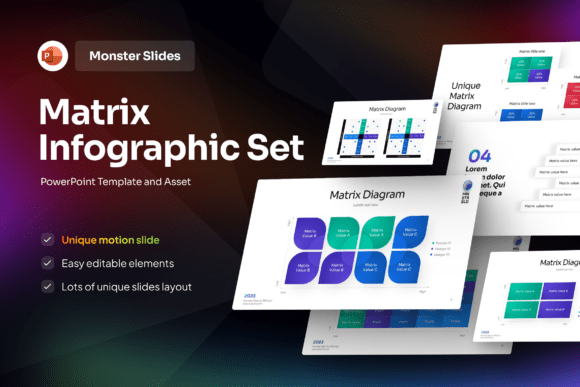
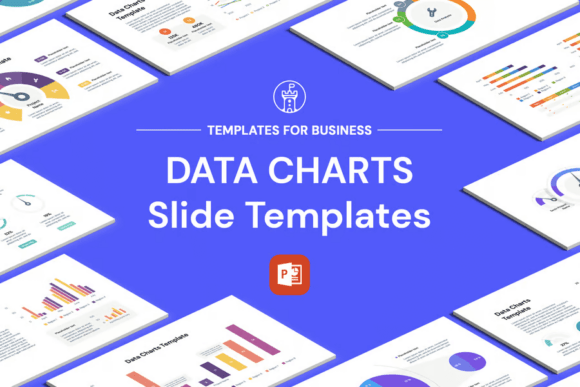
Many presentation tools offer generic charts—bar graphs, pie slices, line plots—but few address the deeper challenge: translating raw numbers into narrative coherence. The Data Chart Powerpoint Templates collection stands apart because its 55 unique slides are engineered around structural intentionality. Each layout solves a specific communication problem: comparing segmented performance across regions, illustrating sequential growth over time, mapping dependencies in a process flow, or highlighting outliers within a distribution.
Consider a university lecturer explaining climate trend data. A standard stacked bar chart may show temperature anomalies by decade—but one of the templates’ “Timeline Impact Matrix” slides layers year-over-year change, severity thresholds, and regional weighting in a single view. That’s not decoration; it’s cognitive scaffolding. Similarly, a startup founder preparing a Series A pitch might use the “Investment Flow Cascade” slide—not to impress with animation, but to clarify how seed funding converts into user acquisition, then retention, then revenue, with measurable benchmarks at each stage.
Light, Dark, and Everything in Between
Context dictates visibility—and visibility shapes engagement. The Data Chart Powerpoint Templates include both light and dark versions of every slide. This isn’t merely aesthetic preference. A light theme ensures crisp legibility when printed as handouts or projected in well-lit conference rooms. A dark theme delivers superior contrast in dimmed auditoriums or hybrid meeting setups where screen glare competes with ambient light.
Crucially, the switch between modes preserves data integrity. Axis labels remain proportionally sized. Color-coded legends retain their semantic meaning. No element disappears, distorts, or becomes illegible. That consistency eliminates guesswork during last-minute prep—a common pain point for educators delivering back-to-back lectures or consultants juggling client-specific presentations across time zones.
25 Preset Themes: Design Authority Without Design Expertise
Choosing colors shouldn’t require a degree in color theory. The Data Chart Powerpoint Templates include 25 modern, professionally curated themes—each tested for accessibility (meeting WCAG 2.1 AA contrast ratios), visual harmony, and domain appropriateness. A healthcare nonprofit might select the “Calm Teal” theme for reports on patient outcomes; a fintech team could opt for “Precision Slate” when visualizing risk-adjusted returns.
Applying any theme takes one action: open PowerPoint’s Design tab, click the desired palette, and watch all 55 slides update instantly. Charts recolor, backgrounds shift, icon strokes adjust—all while preserving data relationships. There’s no manual reformatting of individual elements, no broken links between master slides and content pages. This seamless propagation reflects deep integration with PowerPoint’s native design engine—not third-party add-ons that risk instability or version incompatibility.
Your Brand, Embedded—Not Stamped On
Generic templates often force a compromise: either dilute brand identity to fit pre-set palettes, or spend hours overriding styles—only to break consistency later. With Data Chart Powerpoint Templates, brand alignment is procedural, not punitive. Using the built-in color customization panel, users input primary and secondary hex codes. The system then intelligently maps those values across data series, annotations, borders, and background overlays—respecting hierarchy and emphasis.
A marketing agency showcasing campaign analytics for a client doesn’t need to rebuild every chart from scratch. They input the client’s brand guidelines once, and every slide—from funnel conversion breakdowns to sentiment analysis heatmaps—conforms automatically. Even gradient fills and transparency levels adapt contextually, ensuring charts feel native to the brand rather than pasted on top.
Infographics Built for Editing—Not Just Viewing
Many “infographic” templates rely on flattened PNGs or uneditable vector imports. That creates fragility: change a number, and the entire graphic must be recreated. In contrast, every infographic element in this set is constructed using PowerPoint’s native shapes, icons, and SmartArt—fully editable, resolution-independent, and responsive to formatting commands.
Need to resize a process diagram to fit a vertical poster? Drag the container—the arrows, text boxes, and connecting lines scale proportionally. Want to emphasize a specific metric in a comparative dashboard? Right-click the data label and choose “Highlight”—the fill, stroke, and shadow update in sync with your selected theme. No external software. No raster degradation. Just intuitive, predictable control.
Accessibility and Inclusivity by Default
Effective data communication serves everyone—including those using screen readers, color-blind viewers, or low-bandwidth connections. These templates embed accessibility best practices directly into their architecture. All charts include alt-text placeholders with clear, descriptive prompts (“Bar chart showing Q3 sales growth by region: Midwest +12%, Northeast +8%, Southwest +19%”). Color-coding always includes pattern or texture fallbacks (e.g., diagonal stripes for one category, dotted fill for another) so distinctions remain legible in grayscale printouts or monochrome displays.
For educators creating materials for diverse learners, this means less time retrofitting and more time teaching. For researchers sharing findings publicly, it ensures compliance with institutional accessibility mandates without sacrificing analytical depth.
Real-World Workflows, Not Just Slides
The value of Data Chart Powerpoint Templates emerges most clearly in workflow integration. A public health analyst tracking vaccination rates doesn’t build charts from scratch—they import CSV data into a compatible template slide, map columns to axes, and let PowerPoint auto-generate the visualization. Then, they apply their department’s “Public Trust Blue” theme and export the slide as a high-res PNG for inclusion in a PDF report or social media carousel.
Similarly, a freelance instructional designer developing an online course module on data literacy uses the “Data Literacy Progression Wheel” slide to visually map skill development stages—from basic chart reading to statistical inference—then customizes colors to match the LMS interface. The same slide serves double duty: as a lecture visual and as a downloadable student reference.
Time Savings That Compound
Estimates suggest professionals spend 6–8 hours crafting a single high-stakes presentation. Roughly 40% of that time goes toward formatting—aligning elements, adjusting fonts, fixing inconsistent spacing, troubleshooting chart glitches. With Data Chart Powerpoint Templates, formatting is standardized and automated. What remains is the higher-value work: refining messaging, validating data sources, rehearsing delivery.
That efficiency compounds. A team adopting these templates for quarterly reviews reduces average deck creation time by 55% within three cycles—not because features are stripped out, but because decision fatigue around design choices is eliminated. Consistency builds recognition. Clarity builds trust. Speed builds capacity for strategic thinking.
Who Benefits—and How
The versatility of Data Chart Powerpoint Templates makes it relevant across disciplines:
- Educators use timeline-based templates to visualize historical cause-and-effect or scientific discovery sequences—turning abstract concepts into spatial narratives.
- Researchers leverage multi-axis comparison slides to present mixed-methods findings side-by-side, bridging qualitative quotes and quantitative metrics without visual dissonance.
- Small business owners apply the “Customer Journey Heatmap” to identify drop-off points in service workflows—then share annotated versions with staff using the dark theme for tablet-based training sessions.
- Hobbyists and creators repurpose the “Project Milestone Tracker” for personal goals—learning a language, building furniture, launching a podcast—with brand colors applied just for fun.
- Nonprofit communicators combine donation trend charts with impact infographics in a single slide, enabling donors to see both financial stewardship and real-world outcomes.
What to Consider Before Adoption
No tool replaces critical thinking—but the right tool removes friction from execution. When evaluating Data Chart Powerpoint Templates, consider your existing tech stack. They require Microsoft PowerPoint (2019 or newer, including Microsoft 365). While editable in web-based PowerPoint, full theme application and advanced customization work best in the desktop app. Also note: these are presentation templates, not data analysis tools. They assume you’ve already cleaned and structured your data elsewhere—Excel, Google Sheets, or BI platforms like Power BI or Tableau.
Finally, recognize that mastery comes from iteration—not installation. Start with three slides aligned to your most frequent use cases. Apply your brand colors. Test them in two different lighting environments. Ask a colleague unfamiliar with the topic whether the core insight is immediately apparent. Refine based on feedback. That deliberate, grounded approach yields stronger results than broad, unfocused adoption.
Conclusion: Clarity as a Practice
Data Chart Powerpoint Templates do more than supply slides—they model a discipline: the practice of making information serve understanding. In an age of information overload, the ability to distill complexity into coherent, trustworthy visuals isn’t just a professional skill. It’s a form of stewardship—for audiences’ attention, for organizational integrity, and for the truth embedded in the data itself. When structure, color, accessibility, and ease of editing converge intentionally, what emerges isn’t just a better presentation. It’s a more thoughtful way of communicating.