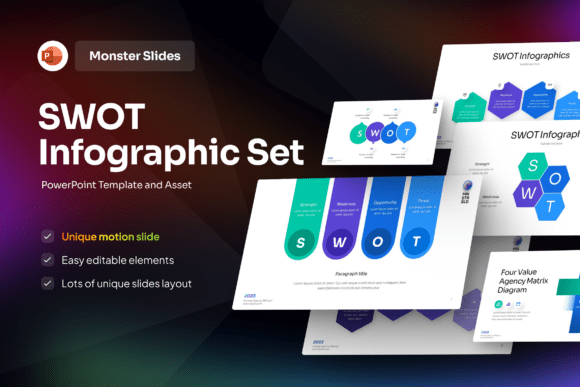
SWOT Infographic PowerPoint Template
A well-structured SWOT analysis doesn’t just clarify strategy—it builds alignment. The SWOT Infographic PowerPoint Template turns that clarity into visual impact: a professionally designed, fully editable presentation kit built for real-world decision-making, not just theory.
This isn’t a generic slide deck with clipart and placeholder text. It’s a 16-slide, widescreen (16:9) template grounded in clean layout principles—balanced whitespace, intentional typography, and intuitive visual hierarchy. Every element serves the analysis: strengths aren’t buried in bullet points; weaknesses are framed with nuance; opportunities and threats appear in context, not isolation. And because it includes a free, web-safe font and full editability, you’re never locked into someone else’s design choices.
Why This Template Fits How People Actually Work
Most SWOT templates fall into two traps: oversimplification (“just fill in the boxes”) or overcomplication (“12 layers of nested diagrams”). This one avoids both by treating each quadrant as a thinking tool—not a container. For example, Slide 4 uses subtle iconography and directional arrows to show how a strength can directly enable an opportunity—or how a weakness might amplify a threat. That small detail shifts the conversation from listing to connecting.
It also respects time. You don’t need design experience to adapt it. Drag-and-drop shapes, consistent color logic (cool tones for internal factors, warm for external), and clearly labeled layers mean marketers can rebrand it for a client pitch in under 20 minutes. Educators can strip back animations and add student-generated examples for a classroom workshop. Freelancers can duplicate slides to compare two product concepts side-by-side—no rebuilding from scratch.
Creative Applications Beyond the Boardroom
Think beyond annual planning. Here’s where the SWOT Infographic PowerPoint Template reveals unexpected flexibility:
- Personal branding audits: A freelance writer maps “strengths” like voice consistency and “threats” like algorithm shifts—then uses the same slide structure to draft a 90-day content pivot plan.
- Classroom strategy games: Teachers assign student teams to analyze a local business using the template, then present findings as live infographics—encouraging research, synthesis, and public speaking in one exercise.
- Nonprofit grant narratives: Instead of dense paragraphs, organizations embed edited SWOT slides into proposals to visually demonstrate self-awareness and strategic realism—making reviewers feel confident in their capacity.
- Product launch prep: Teams use separate slides to map SWOT for three customer segments (e.g., early adopters vs. budget-conscious users), revealing where messaging must shift—not just what to say, but who needs to hear it first.
None of these require advanced tools. They rely on the template’s built-in scaffolding: clear headings, proportional quadrants, and space for concise annotations—not essays. That restraint is intentional. Clarity emerges when you limit what’s on screen, not when you add more.
Adapting for Different Audiences—Without Losing Rigor
A board of directors needs different emphasis than a startup cohort or a university seminar. The SWOT Infographic PowerPoint Template supports that shift without redesigning:
For executives: Use Slide 12 (the comparative summary) to layer two analyses—current state vs. target state—highlighting gaps with minimal text and high-contrast color cues. Add footnotes linking to data sources in the help guide.
For students or new entrepreneurs: Duplicate Slide 3 (the foundational SWOT grid) and annotate each cell with real examples—e.g., “Weakness: No in-house SEO expertise → Action: Partner with certified freelancer by Q3.” This grounds abstraction in action.
For remote teams: Export individual slides as PNGs and drop them into Notion or Miro. The consistent ratio and spacing ensure they scale cleanly across platforms. No pixelation. No reformatting.
Keeping It Clear, Consistent, and Human
Great SWOTs avoid vague statements (“strong brand”) and passive framing (“market is competitive”). This template helps you sidestep those pitfalls—not through rules, but through design:
- The “Opportunities” quadrant uses upward-arcing lines in its background motif—subtly reinforcing growth orientation. That visual nudge encourages phrasing like “Untapped demand in rural clinics” instead of “Healthcare expansion possible.”
- Each slide includes a designated “Evidence or Source” line at the bottom—small, unobtrusive, but non-optional. It quietly prompts contributors to ask: What shows this is true?
- Icons are minimal and metaphor-accurate (e.g., a shield for “strengths,” not a star). No decorative fluff. Every visual earns its place.
That discipline transfers to your content. When the structure expects specificity, you deliver it. When the layout rewards concision, you edit harder. The template doesn’t do the thinking—but it makes shallow thinking harder to hide.
Getting Started—Without Overthinking
You don’t need to master all 16 slides at once. Start with Slide 5—the core four-quadrant layout. Fill it with your top three items per section, using the help guide’s phrasing tips (e.g., begin weaknesses with verbs: “Relies on single supplier” not “Supply chain risk”). Then move to Slide 8, which overlays connections between quadrants—ask: Which strength most directly counters our biggest threat? That’s often where strategy begins.
If you’re customizing for a specific audience, use Slide 15—the customizable cover—to reflect tone: swap the default title font for something bolder for investor decks, or soften the color palette for internal team workshops. The file includes layered guides so you never guess at alignment.
And remember: stock images aren’t included—and that’s deliberate. It invites you to use authentic photos, original illustrations, or even hand-drawn scans scanned and placed as PNGs. Real context beats generic visuals every time.
The SWOT Infographic PowerPoint Template works because it meets people where they are: pressed for time, needing credibility, and aiming for impact—not perfection. It’s a tool for making decisions visible, not just documented. When your next strategy session starts, let the structure carry the weight—so your insights get the attention they deserve.