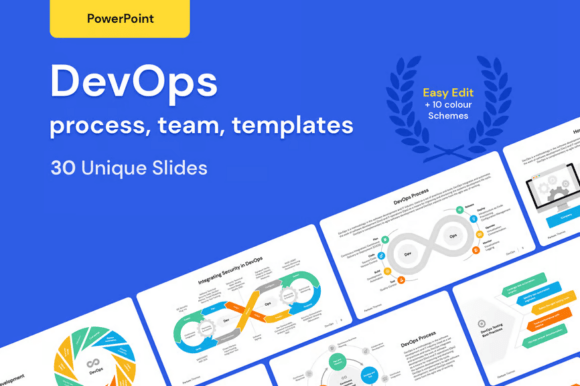
DevOps Methodology Project PowerPoint: A Practical Framework for Modern IT Delivery
Organizations across industries are shifting from siloed development and operations to integrated, automated, and collaborative workflows — and the DevOps Methodology Project PowerPoint serves as more than a presentation tool. It’s a structured, visual articulation of how DevOps principles translate into real-world execution. Designed for clarity and adaptability, this resource supports teams at every stage of adoption — from first-time practitioners exploring What is DevOps? to enterprise architects refining their Enterprise DevOps Adoption Model.
Understanding DevOps Beyond the Buzzword
At its core, DevOps is not a role, a toolchain, or a department — it’s a cultural and technical operating model that unifies software development (Dev) with IT operations (Ops). The DevOps Methodology redefines how value flows from idea to production: faster, safer, and with continuous feedback. Unlike traditional waterfall approaches, DevOps treats infrastructure as code, testing as continuous validation, and delivery as an ongoing capability — not a project milestone.
This mindset shift is codified in The Three Ways of DevOps Practice: flow (accelerating work from dev to ops), feedback (creating rapid, actionable insights across stages), and continual learning and experimentation (embedding improvement into daily work). These aren’t abstract ideals — they’re observable behaviors reflected in team rituals, automation coverage, and incident response cycles.
A Visual Architecture for Clarity and Consistency
The DevOps Methodology Project PowerPoint transforms these concepts into 30 unique, editable slides — each built with clean, modern shapes optimized for 16:9 HD and Retina displays. Every element — icons, process flows, matrices, and timelines — is fully editable in PowerPoint 2010 through Microsoft 365. No Photoshop or Illustrator required. You resize, recolor, or relabel in seconds — no embedded images or locked layers.
For example, the DevOps Process CI/CD slide visually maps commit → build → test → deploy → monitor as a closed-loop pipeline, with clear handoff points and failure thresholds. Another slide illustrates the DevOps Maturity Model across five levels — from “Initial” (ad hoc automation) to “Optimizing” (self-healing systems with predictive analytics) — enabling teams to benchmark progress objectively.
Models, Templates, and Real-World Application
Among the most valuable components are the pre-built DevOps Models and Templates for PowerPoint. These include:
- The 7 Principles for DevOps Success — grounded in empirical evidence, not theory: small batches, blameless postmortems, telemetry-driven decisions, shared ownership, automation-first discipline, continuous improvement rhythms, and cross-functional empathy.
- DevSecOps Controls — showing where security embeds naturally: SAST/DAST in CI, policy-as-code in IaC validation, secrets scanning pre-deploy, and runtime compliance checks — all mapped to NIST SP 800-53 and OWASP ASVS.
- Testing in DevOps — a layered pyramid (unit > integration > contract > UI > exploratory) with ownership split across roles: developers own unit tests, QA owns contract and performance suites, and product owners define acceptance criteria in feature flags.
- Enterprise DevOps Adoption Model — a phased rollout strategy covering governance (center-led enablement), toolchain standardization (not uniformity), metrics alignment (DORA + business KPIs), and cultural scaffolding (communities of practice, internal open source).
Each template reflects actual implementation patterns — like how a financial services firm uses the Integrating Security in DevOps slide to align AppSec engineers with platform teams during sprint planning, or how a SaaS startup adapts the DevOps for Development Team slide to clarify local vs. shared responsibilities for environment provisioning and log retention.
Roles, Responsibilities, and Shared Accountability
One persistent misconception is that DevOps replaces roles — it doesn’t. Instead, it reshapes them. The DevOps Engineer Role, for instance, isn’t a gatekeeper of tools but a catalyst: automating repetitive tasks, documenting tribal knowledge, mentoring peers in observability practices, and translating business SLAs into SLOs and error budgets.
Other key roles clarified in the deck include:
- Platform Engineers — building internal developer platforms (IDPs) that abstract cloud complexity while enforcing guardrails.
- SREs (Site Reliability Engineers) — balancing feature velocity with system resilience using error budget policies and toil reduction targets.
- Product Ops Specialists — bridging product management and engineering by instrumenting usage telemetry and correlating deployment events with customer behavior.
Crucially, the DevOps Methodology Project PowerPoint avoids prescribing rigid job descriptions. Instead, it presents responsibility matrices — showing *who initiates*, *who validates*, *who approves*, and *who monitors* for common workflows like production deploys or incident response.
Design That Supports Learning and Customization
Clarity extends beyond content to design. The presentation uses free Google Fonts (Inter for body, JetBrains Mono for code snippets) and ships with 10 professionally curated XML color themes — from high-contrast accessibility palettes to muted corporate schemes. Need to match brand guidelines? Create your own theme in under two minutes: define six hex values (primary, accent, background, text, success, warning), save as XML, and apply globally with one click — no manual slide-by-slide editing.
All shapes are vector-based, scalable without pixelation, and retain editability on any device. Whether presenting to executives (using the DevOps Development Benefits slide — reduced MTTR by 40–75%, 200x more frequent deployments, 50% fewer change failures) or onboarding interns (via the Introduction to DevOps infographic), the visual language remains consistent and accessible.
From Theory to Tactical Execution
Where many resources stop at definitions, this framework emphasizes *how DevOps Process Works* in context. For example:
- The Using DevOps to Solve Your Delivery Challenges slide walks through common pain points — “releases take weeks”, “prod incidents spike after deploys”, “QA is always behind” — and pairs each with concrete interventions: trunk-based development, canary analysis, and shift-left test automation — all illustrated with before/after workflow diagrams.
- The DevOps testing Approach slide contrasts legacy “test-last” cycles with modern parallelized test orchestration — showing how Cypress runs UI tests against staging while Datadog Synthetics validates API contracts in production — all triggered from the same PR event.
- The Define All Aspects of IT slide maps DevOps scope across infrastructure, data, security, monitoring, and even documentation — treating wikis and runbooks as versioned, tested artifacts.
This isn’t hypothetical. Teams using these slides report measurable outcomes: 30% faster onboarding for new hires, 65% reduction in misconfigured environments, and improved cross-team trust measured via quarterly pulse surveys.
Why Editability Matters in Practice
Static decks fail when reality shifts — and it always does. New compliance requirements emerge. Toolchains evolve. Team structures change. That’s why every shape in the DevOps Methodology Project PowerPoint is editable — not just text boxes, but interconnected process arrows, modular architecture diagrams, and responsive org charts. You don’t rebuild; you refine.
Consider the DevOps Core Principles slide: instead of a static list, it uses grouped shapes with drag-and-drop labels. A healthcare IT team might add “HIPAA-aligned audit trails” beneath “Automation”, while a gaming studio inserts “Live ops readiness” under “Continuous Feedback”. The structure stays intact; the meaning stays relevant.
Supporting Diverse Audiences with Precision
Whether you’re an educator designing a university module, a hobbyist building a personal CI/CD lab, a researcher analyzing adoption barriers, or a CTO scaling platform capabilities — the deck adapts. Educators use the DevOps Process flowchart to teach feedback loops; researchers reference the DevOps Maturity Model to categorize case study findings; business owners leverage the DevOps Development Benefits slide to justify investment in platform engineering.
No audience is addressed generically. Each slide includes subtle contextual cues — like labeling latency metrics in milliseconds for engineers or framing cycle time in “days to value” for executives — ensuring resonance without oversimplification.
Building Confidence Through Transparency
Finally, the package includes detailed instructions — not just “how to change colors”, but why certain palettes improve accessibility, when to use monochrome vs. chromatic emphasis in complex diagrams, and how to validate theme consistency across 30 slides using PowerPoint’s built-in Design Ideas pane. There’s also guidance on exporting individual slides as SVG for documentation sites or embedding animated transitions for virtual workshops.
This level of transparency reinforces E-E-A-T: expertise (grounded in real implementations), experience (refined through user feedback), authoritativeness (aligned with DORA, SAFe DevOps, and CNCF best practices), and trustworthiness (no vendor lock-in, no hidden dependencies).
The DevOps Methodology Project PowerPoint doesn’t promise transformation — it provides the scaffolding to build it yourself, one editable shape, one calibrated metric, one shared understanding at a time.